
Review of Liu Zongwen, Liu Yanping, Wu Minghua, et al: cancer diagnosis and treatment effect monitoring based on time resolved fluorescence imaging microscope (FLIM)
content validity
Time resolved fluorescence imaging microscopy (FLIM) has been developed rapidly in the past 30 years and has been widely used in biomedical engineering. The latest progress in the design of fluorescent labeled probes further broadens the application prospect of fluorescence. Because fluorescence time is more sensitive to the changes of microenvironment and molecular level, flim has a great application prospect in the diagnosis and efficacy evaluation of diseases.
Currently, cancer-related flim applications can be divided into three categories: (I) detection of intracellular or extracellular autofluorescence molecules represented by NAD (P) h by flim for cell metabolism research( II) flim combined with fluorescence resonance energy transfer for protein-protein interaction monitoring( III) flim combined with fluorescent labeled biosensor for detection of cancer abnormal molecules. The development of nanomaterials and rapid calculation of fluorescence time, as well as the discovery of new cancer biomarkers, promote the optimization of flim, and provide more opportunities for medical research and clinical application of cancer diagnosis and treatment.
Professor Liu Yanping, Professor Wu Minghua, Central South University; In this paper, associate professor Zongwen Liu of the University of Sydney in Australia reviewed the frontier research on the application of cancer-related flim from 2015 to 2020, discussed the possibility of flim in cancer diagnosis and anti-cancer treatment in the future, and summarized the shortcomings of flim development today and the future development direction in the field of cancer.
Reading guide
Clinical application and development of I flim
Fluorescence time is more and more used in the field of fluorescence imaging because it is sensitive to the change of microenvironment. Since the invention of the first single molecule counting time-resolved fluorescence technology (tcspc-flim) in the 1980s, flim has made great progress in imaging speed, fluorescence time measurement accuracy and resolution. For example, two-photon and multi photon fluorescence flim technology has not only been developed at the laboratory level, More and more clinical flim devices have been developed and gradually applied. In biomedical field, flim also has potential in many fields, such as intracellular ion concentration, protein interaction, skin diseases, etc, Fluorescence resonance energy transfer (FRET) and biosensor are three aspects of the recent five years of flim application in the early diagnosis of cancer and efficacy monitoring.
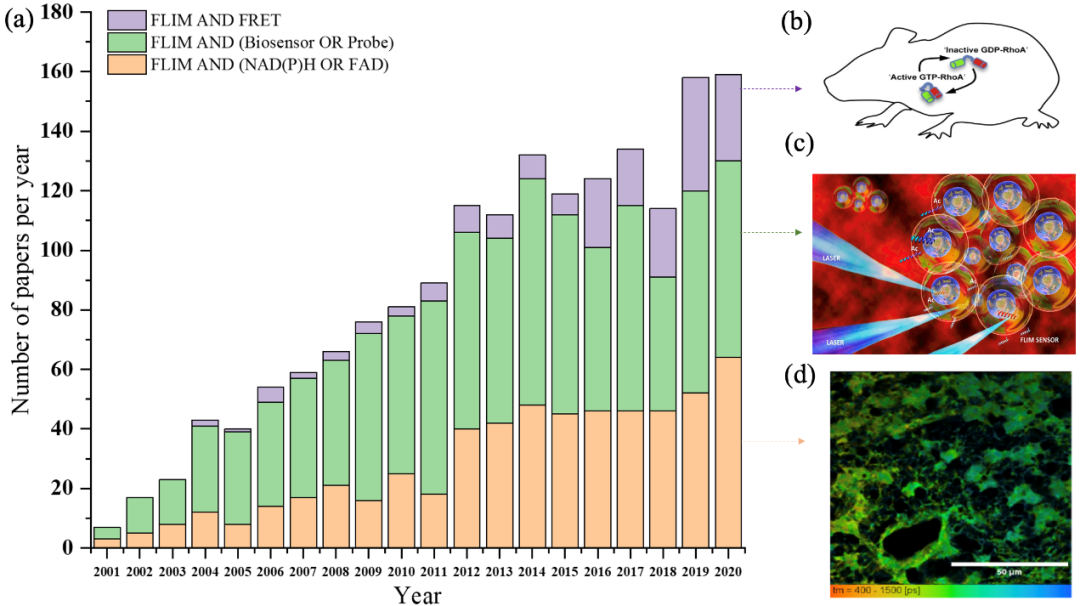
Figure 1. The number of publications combining NAD (P) h or fad (Orange), probe, biosensor (green) and FRET (purple) in flim field from January 2001 to December 2020 (data from web of science, January 2021)( a) Histogram of the number of papers in various fields from 2001 to 2020( b) RhoA FRET biosensor mice were used to monitor RhoA activity in mammalian tissues during development and disease progression( c) Under laser excitation, tcspc-flim biosensor was used to detect acetyltransferase activity in real time( d) Time resolved fluorescence images of NADH in glioblastoma stem cell (GSC) were obtained.
II Basic Principles of flim
As shown in Fig. 2a, when the molecule is excited to the excited state, it will return to the ground state, and fluorescence is a form of energy radiation from the excited state to the ground state. The fluorescence lifetime can be simply understood as the average residence time of all molecules in the excited state of a substance. It can also be recorded by accurate fluorescence intensity decay curve. The time when the fluorescence intensity decays from I ₀ to I ₀ / E is regarded as the fluorescence lifetime.
In terms of the structure of time-resolved fluorescence microscope (FLIM), FIG. 2B shows that flim is developed on the basis of the basic framework of fluorescence microscope by fusing single photon detector and photon timing device. Based on the measurement method of fluorescence time, flim can be divided into time domain and frequency domain. In time domain, flim can be divided into three categories: TCSPC, time gated and streak camera. The basic principle of tcspc-flim is shown in the example diagram in Fig. 2C. Through the signal amplification of photomultiplier tube and the time amplitude, time-frequency and time-frequency measurement, flim can be divided into three categories The amplitude electric conversion constructs the fluorescence intensity attenuation curve of photons detected at different times according to the arrival time, so as to obtain the fluorescence time. The basic principle of frequency domain flim is as shown in Fig. 2D. Based on the modulation of stimulated light and the demodulation of detection signal, the fluorescence time is obtained by analyzing parameters such as phase shift of curve. According to the difference of fluorescence from single or multiple fluorescent molecules, the fluorescence time can be obtained by single exponential or multi exponential function analysis. In order to avoid the disadvantages of the above two methods, which need to judge the number of fluorescent molecules in advance and accurately fit the fluorescence decay curve, phasor analysis has been more and more used in the field of fluorescence time analysis. The parameters measured by flim instrument are converted into G and s values for phasor plot by using the formula. The obtained phasor plot is further analyzed to obtain the information of the number of fluorescent molecules in the detected sample and their fluorescence time, and the flim image can be drawn on this basis.
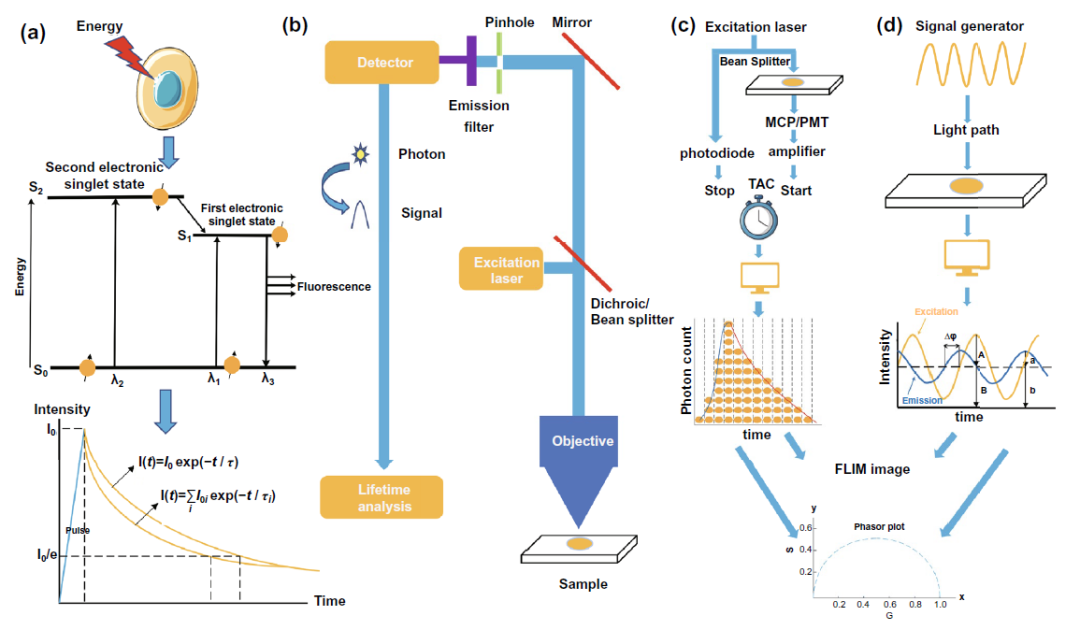
Figure 2. Basic concepts of fluorescence time, fluorescence imaging, tcspc-flim and frequency domain flim( a) The basic principle of fluorescence time measurement( b) The basic structure of fluorescence imager equipped with fluorescence time analysis device( c) Schematic diagram of tcspc-flim device( d) Schematic diagram of frequency domain flim device.
Autofluorescence of III flim combined with NAD (P) H molecule for monitoring cancer cell metabolism
Based on the autofluorescence characteristics of reduced nicotinamide adenine dinucleotide (NADH, NADPH) and oxidized xanthine dinucleotide (FAD), as well as the changes of NADH, fad and other molecules in the process of cell glycolysis and tricarboxylic acid cycle and subsequent oxophosphos as shown in Fig. 3b, Using flim to detect the changes of fluorescence time of these autofluorescence molecules can monitor the intracellular metabolism of cancer cells. In this part, according to the different direct detection parameters, it can be divided into three parts: fluorescence time, ratio and phasor diagram, and multi parameter flim.
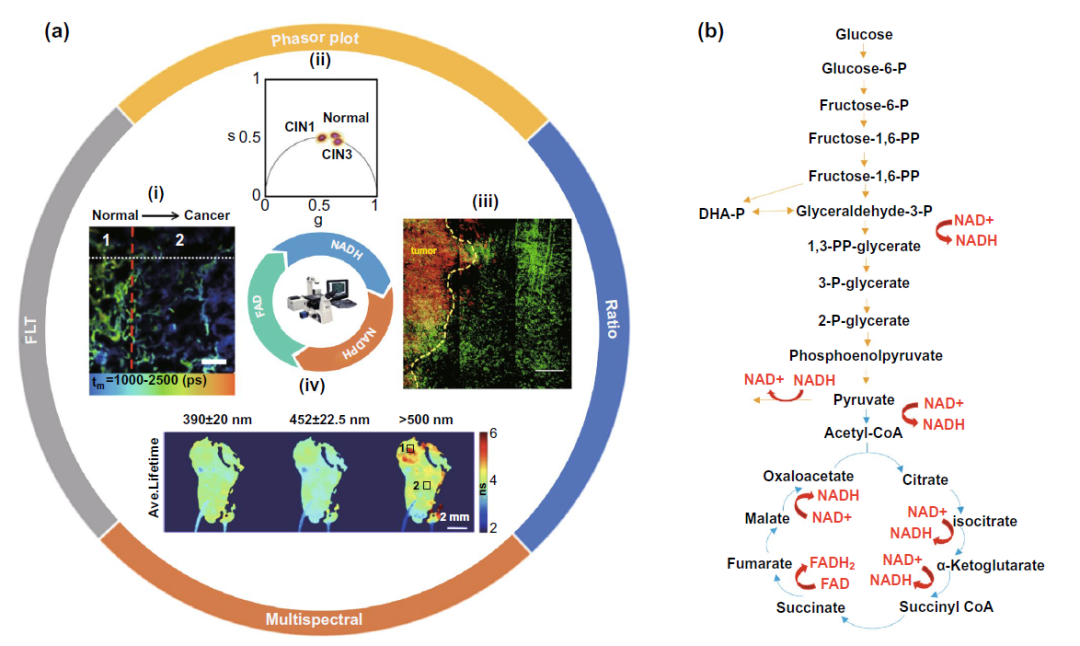
Figure 3. The study of flim binding NADH and fad autofluorescence and the changes of NADH and fad molecules in the core glucose metabolism pathway( A-I) based on the difference of fluorescence time, flim assisted lung cancer resection( A-II) flim phasor mapping assisted cervical precancerous lesions typing( A-III) NADH / NAD + ratio was used to assist the determination of tumor edge lesions( A-IV) multispectral flim assisted localization and typing of oral precancerous lesions( b) The changes of NADH and fad molecules in glycolysis and tricarboxylic acid cycle.
In the part of fluorescence time, it is worth noting that in the process of oxidative phosphorylation, NADH molecules will combine with coenzyme to form protein bound NADH state, and the fluorescence time of NADH molecules will increase from 0.4 ns to 2 ns. The Warburg effect proposed by Warburg in the last century also pointed out that cancer cells prefer to use glycolysis for energy supply in the cytoplasm of cells than normal tissue cells, and inhibit the production of ATP through tricarboxylic acid cycle and oxidative phosphorylation, so the fluorescence time in cancer cells is often shorter than that in normal tissue cells, With this feature, the edge of tumor resection can be determined as shown in figure 3a-i. But recently, more and more studies have found that tumor stem cells do not comply with Warburg effect, and the specific reason remains to be explored.
The ratio and vector diagram are based on the changes of these autofluorescence molecules in the process of metabolism, and the ratio is used to amplify the difference before and after metabolism, so as to achieve the purpose of sensitive detection. As shown in Fig. 3a-iii, the increased NADH / NAD + ratio during glycolysis and the Warburg effect of tumor cells can help to determine the resection edge of tumor. The phasor diagram reflects the change of the ratio of free NADH / bound NADH in cells through the changes of various autofluorescence molecules such as elastin, fad, especially free NADH and protein binding NADH in the metabolic process (FIG. 4A), and realizes the application in many clinical fields such as cervical precancerous lesions (Fig. 3a-ii), leukemia cell subtype classification (Fig. 4b).
In the field of multi parameter flim, multispectral flim (MS FLIM) for cancer diagnosis is often focused on oral precancerous lesions (Fig. 3a-iv) and basal cell carcinoma of skin. At the same time, the computer analysis and processing of Gaussian distribution, information entropy and fluorescence time, and the multi parameter analysis and processing model including fluorescence time are also expected to assist in the clinical diagnosis and classification of various skin diseases represented by basal cell carcinoma (Fig. 4C).
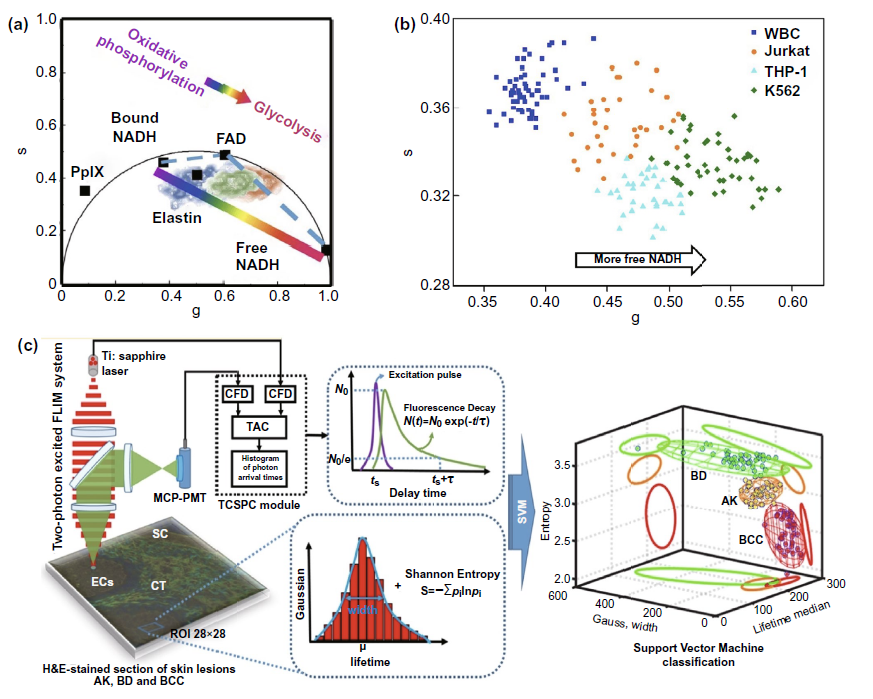
Figure 4. Flim phasor diagram and multi parameter flim classification system for cancer research( a) According to the principle of drawing flim phasor diagram, the information of metabolic changes such as cell oxidative phosphorylation and glycolysis in different samples can be obtained by analyzing the position of autofluorescence molecular phasor points in the phasor diagram( b) The cluster distribution of fluorescent molecules obtained from different samples in flim phasor diagram was used to reflect the differences of cell metabolism in different detection samples. Based on this, leukemia cell subtypes were classified and diagnosed( c) Support vector system was used to assist the diagnosis and classification of basal cell carcinoma (BCC), actinic keratosis (AK) and Bowen s disease (BD).
ope (TIRF) or time-resolved fluorescence microscope (FLIM) can be used to detect FRET efficiency or fluorescence decay time of donor fluorescent molecules. According to the different types of FRET fluorescent pairs, fret-flim can be divided into five types: cleavage, binding domain, tag, dimer and substrate. Fluorescence detection of cleavage protein mainly focuses on the activity detection of cleavage protein, as shown in Fig. 5B. Binding domain is often used to detect the activity of the target protein, such as RhoA protein shown in Fig. 5C, by using the result of whether FRET occurs or not caused by the conformational difference of the target molecule when binding with different substrates. Tag type is used to realize indirect detection of activity based on the change of FRET phenomenon of connected FRET fluorescent pairs caused by the conformation change of target protein. The target of figure 5D is PKB protein activity detection. As for the application of dimer type fluorescent molecules to binding flim, it is more common to detect the number or activity of receptors that dimerize on the cell membrane or exosomes, such as HER2 and HER3 receptors of epidermal growth factor receptor family (Fig. 5e). The basic mode of the last substrate type is very close to that of the tag type. The biggest difference between the two types is that the tag type changes the FRET effect caused by the activation of the target protein itself, while the substrate type changes the FRET effect of the FRET fluorescent pairs connected to the target substrate by changing the conformation of its target substrate (Fig. 5F). By changing the number or activity of intracellular or membrane proteins, we can achieve the goal of cancer diagnosis or evaluation of anti-cancer treatment efficacy at the molecular level, and improve the prognosis of cancer patients.
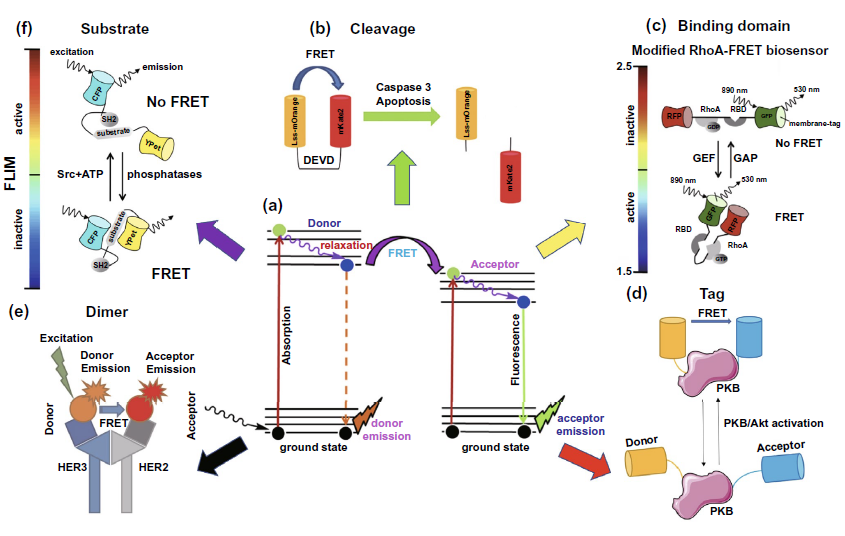
Figure 5. Application of FLIM-FRET in cancer diagnosis and efficacy improvement( a) The model diagram of FRET phenomenon between donor and acceptor in FRET fluorescent molecular pair( b) Cleavage type: the activity of Caspase-3 was detected by fret-flim, indicating the state of apoptosis( c) Binding domain type: the activity of RhoA protein was detected by fret-flim, and the activity of RhoA protein was evaluated by whether FRET occurred between the linked RFP and GFP fluorescent protein molecules( d) Tag type: the activity of PKB / Akt signaling pathway was evaluated by the change of FRET effect of serine and threonine fluorescent molecular markers linked to PKB protein( e) Dimer type: the level of her3-her2 dimer on cell membrane was detected by FRET phenomenon of alexa546 and Cy5 fluorescent molecular pairs labeled on HER3 and HER2( f) Substract type: the activity of Src protein in cells was detected by the phenomenon that the FRET effect between CFP and ypet fluorescent protein molecules linked to the substrate disappeared after the reaction of SRC with the substrate.
Application of V flim combined with fluorescent labeled probe
5.1 detection of intracellular molecular changes by flim
The detection of intracellular molecular changes by flim can be divided into two categories: nuclear and cytoplasmic. In the nuclear part, FIG. 6A discusses the detection of acetyltransferase activity in combination with an acetyltransferase activity biosensor (HATS), so as to assist the evaluation of the efficacy of anti-cancer drugs for histone acetylation. In the cytoplasm, flim can be combined with new quantum dots and fluorescent labeled coumarin probe to monitor the two major metabolism conditions in the cytoplasm - glucose metabolism and lipid metabolism, and assist the metabolic research and clinical diagnosis and treatment of cancer cells (Fig. 6a, c).
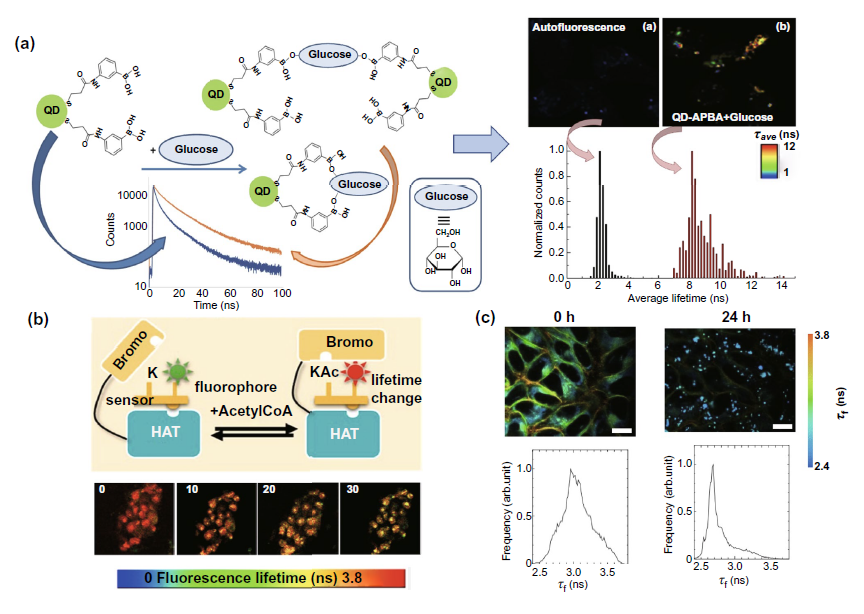
Fig. 6. Fluorescence labeled probe combined with flim to detect the changes of intracellular molecules( a) Left: the schematic diagram of qd-apba probe detecting the glucose content in cytoplasm. Right: results of probe combined with flim cells( b) A fluorescent labeled acetyltransferase biosensor combined with flim was used to detect the activity of acetyltransferase in the nucleus from the perspective of fluorescence time. The above figure is the experimental mechanism diagram, and the following figure is the experimental result diagram of flim biosensor detection after adding acetyltransferase activity inhibitor( c) The lipid droplet imaging of HeLa cells treated with oleic acid in the time dimension of intracellular fluorescence was realized by using fluorescent labeled coumarin probe.
5.2 flim detection of membrane structure change
Since the changes of receptors on membrane detected by flim have been discussed in detail in the part of FLIM-FRET, this part mainly focuses on the application of flim combined with fluorescent probe to detect the potential of cell membrane and mitochondrial membrane and the changes of membrane viscosity. These parameters are related to cell membrane permeability and indirectly reflect cell activities such as malignant transformation. In the field of membrane potential measurement, the representative study selected in Fig. 7a is to use flim to detect the fluorescence time of voltagefluor fluorescent dye labeled probe. Due to the weakening of light induced electron transfer during membrane depolarization, the fluorescence time detected from hyperpolarization to depolarization will be prolonged. In the field of membrane viscosity measurement, fluorescent probes are mostly based on the boron chloride complex dipyromethyl structure (BODIPY) shown in the left figure of Fig. 7b. As shown in the right figure of Fig. 7b, when the viscosity of the membrane increases, the energy barrier from the planar configuration to the butterfly configuration of the fluorescent probe will be increased, resulting in the weakening of the non radiative pathway of the excited state returning to the ground state, thus enhancing the energy radiation pathway represented by fluorescence and prolonging the fluorescence time. Figure 7C shows the use of bodipy2 probe combined with flim to achieve flim imaging of CT26 tumor in vivo and detect the cell membrane viscosity.
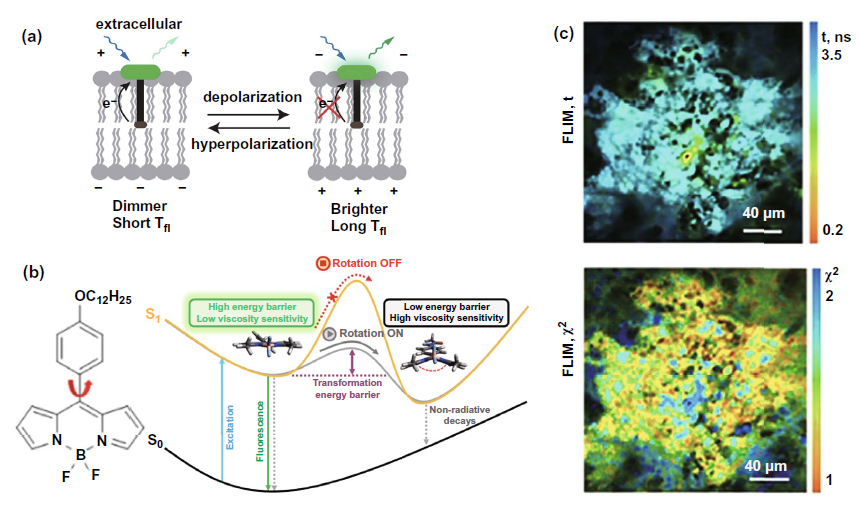
Figure 7. Flim combined with fluorescent probe to detect membrane potential and viscosity for cancer diagnosis and efficacy monitoring( a) Mechanism diagram of voltageflow probe combined with flim to measure membrane potential( b) Left: BODIPY structure represents the molecular formula; Right: the mechanism of using BODIPY probe to detect the change of membrane viscosity( c) Above: flim images of CT26 tumor in vivo obtained by flim combined with bodipy2 probe were used to evaluate membrane viscosity; Below: time resolved fluorescence attenuation flim map, which is used to verify whether bodipy2 probe can be used in animal tumor flim imaging.
5.3 detection of flim in tumor extracellular environment
In the tumor extracellular environment, we mainly discussed whether the combination of fluorescent probes, quantum dots and other fluorescent materials is expected to realize the detection of tumor microenvironment pH, vascular composition and exosomes. Cbd-ecfp fused with ECFP fluorescent protein can be used to reflect the pH in vitro matrix by fluorescence time (Fig. 8a). Tumor angiography is based on the long-term fluorescence characteristics of quantum dots circulating in the blood to explore the morphological differences between tumor tissue and normal tissue (Fig. 8b). In Fig. 8C, the fluorescence time of the membrane viscosity probe is used to reflect the membrane viscosity of the exosome, so as to obtain the information of the exosome size, which is expected to be used in the early diagnosis of clinical cancer.
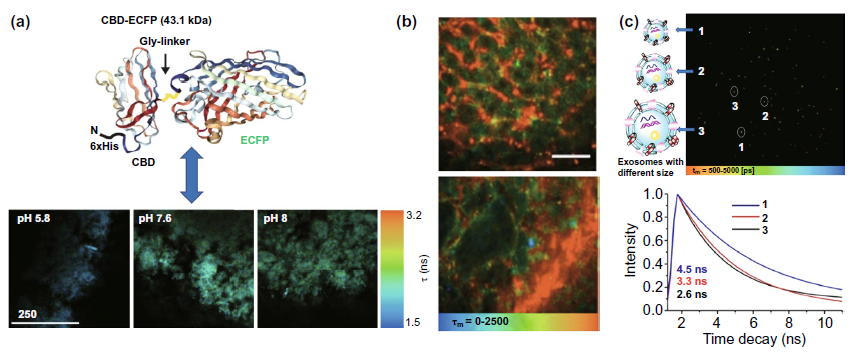
Figure 8. Application of flim in extracellular environment( a) The fluorescence time of cbd-ecfp detected by flim reflected the pH of matrix in vitro( b) The long-term fluorescence of quantum dots is used to realize tumor microvascular imaging( c) The fluorescence time of mem-bdp membrane viscosity probe was used to detect the size of exosomes.
5.4 detection of anticancer drug delivery with fluorescence emission by flim
Fig. 9A is to explore the mechanism of paclitaxel delivery by exosomes and microbubbles labeled with og fluorescence using flim. It is found that exosomes mainly enter cells through endocytosis, while microbubbles enter cells through endocytosis and fusion with cell membrane. In the study of liposome delivery strategy, flim was used in the study of figure 9b to explore the problem of drug loading leakage caused by the formation of biomolecular coronal around liposomes during in vivo delivery. In addition to the previous two types of anticancer drug delivery strategies, new strategies based on nanostructures have emerged in recent years. A nano delivery strategy of PAH CIT DOX as shown in Figure 9C has been constructed and studied in the laboratory, Flim phasor plot and pdlpi were obtained by flim to monitor the release and distribution of doxorubicin in cells, optimize the delivery strategy and improve the efficacy.
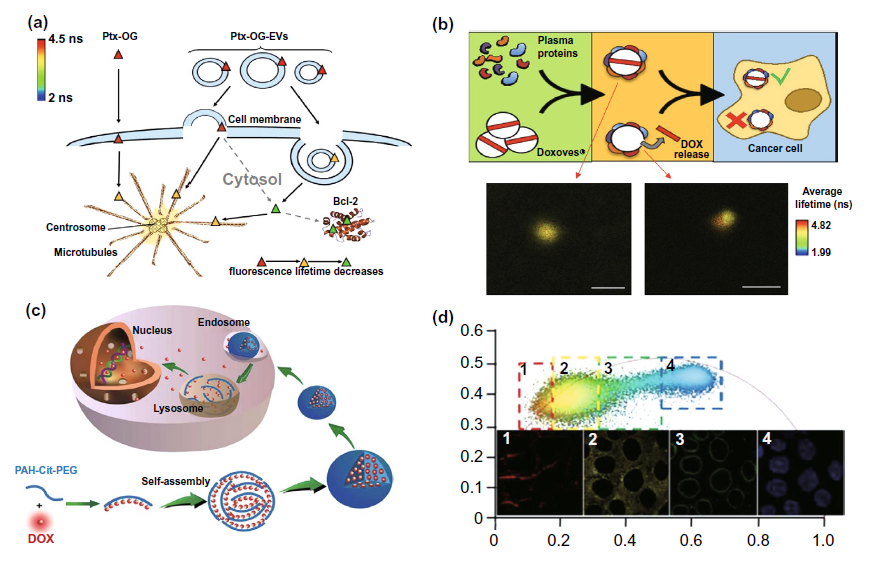
Figure 9. Flim monitoring adjuvant efficacy of anticancer drug delivery with fluorescence emission characteristics( a) Flim was used to explore the mechanism of paclitaxel og loaded exosomes and vesicles( b) Flim was used to study the leakage of drug carrier caused by biomolecular crown formation (BC) in liposome delivery strategy( c) Mechanism diagram of a novel nano doxorubicin (DOX) drug delivery system PAH CIT DOX( d) The distribution of DOX delivered by PAH CIT DOX strategy in cells was detected by using the pdlpi map detected by flim.
VI summary and Prospect
1. Flim imaging speed, resolution improvement and integration with other optical technologies.
2. The clinical application of flim in the biocompatibility, targeting and deep penetration of fluorescent molecules, such as near-infrared fluorescent molecules, still needs to be carried out.
3. The application of flim combined with NAD (P) H autofluorescence in metabolic detection can be extended to immune cells and neurons in tumor microenvironment and assist in tumor immunotherapy.
4. The combination of fluorescence probe and FLIM is expected to realize the detection of RNA in tumor exosomes, and the anticancer drug delivery represented by DOX can also be combined with exosomes strategy and optimized by flim monitoring.
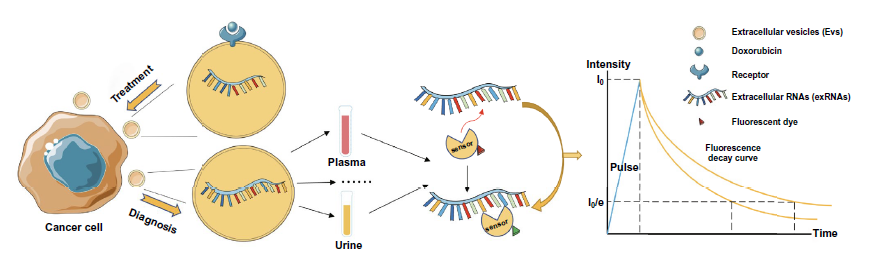
Figure 10. Exosome flim for exosome RNA detection and anticancer drug delivery.
This information is from the Internet for academic exchange only. If there is any infringement, please contact us to delete it immediately
+86-18915413828(WhatsApp&WeChat)
Previous: Xu Fei, Jiangnan Unive